
Black America Went from Second to Third in One Generation
Post-1965 Immigration’s Unexpected Impact on America’s Demographics, Jobs, and Politics


“Black Americans built a demographic presence over centuries. In a single generation, that balance has shifted in city after city.”
Seven months ago, I wrote a piece titled The Replacement Blacks. It examined how political coalitions begin to shift when the underlying numbers begin to shift first. The argument was not complicated. Politics follows incentives, and incentives follow population.
What I did not fully lay out at the time was how large that demographic shift actually was. The argument was there, but the scale was not.
So I went back and looked at the numbers more carefully. Not polling. Not campaign messaging. Just population data, broken down across cities and states.
What shows up is not confined to a single region and is not limited to a few well-known examples. It appears across large cities, mid-sized metros, and smaller places that rarely make national headlines. The pattern is consistent enough that it is difficult to dismiss as a coincidence.
The Numbers Tell the Story First
Before getting into the examples, it helps to clarify how the Census measures these groups. “Hispanic” is categorized as an ethnicity rather than a race, which means it cuts across racial classifications. That technical detail matters for interpretation, but it does not change the broader outcome.
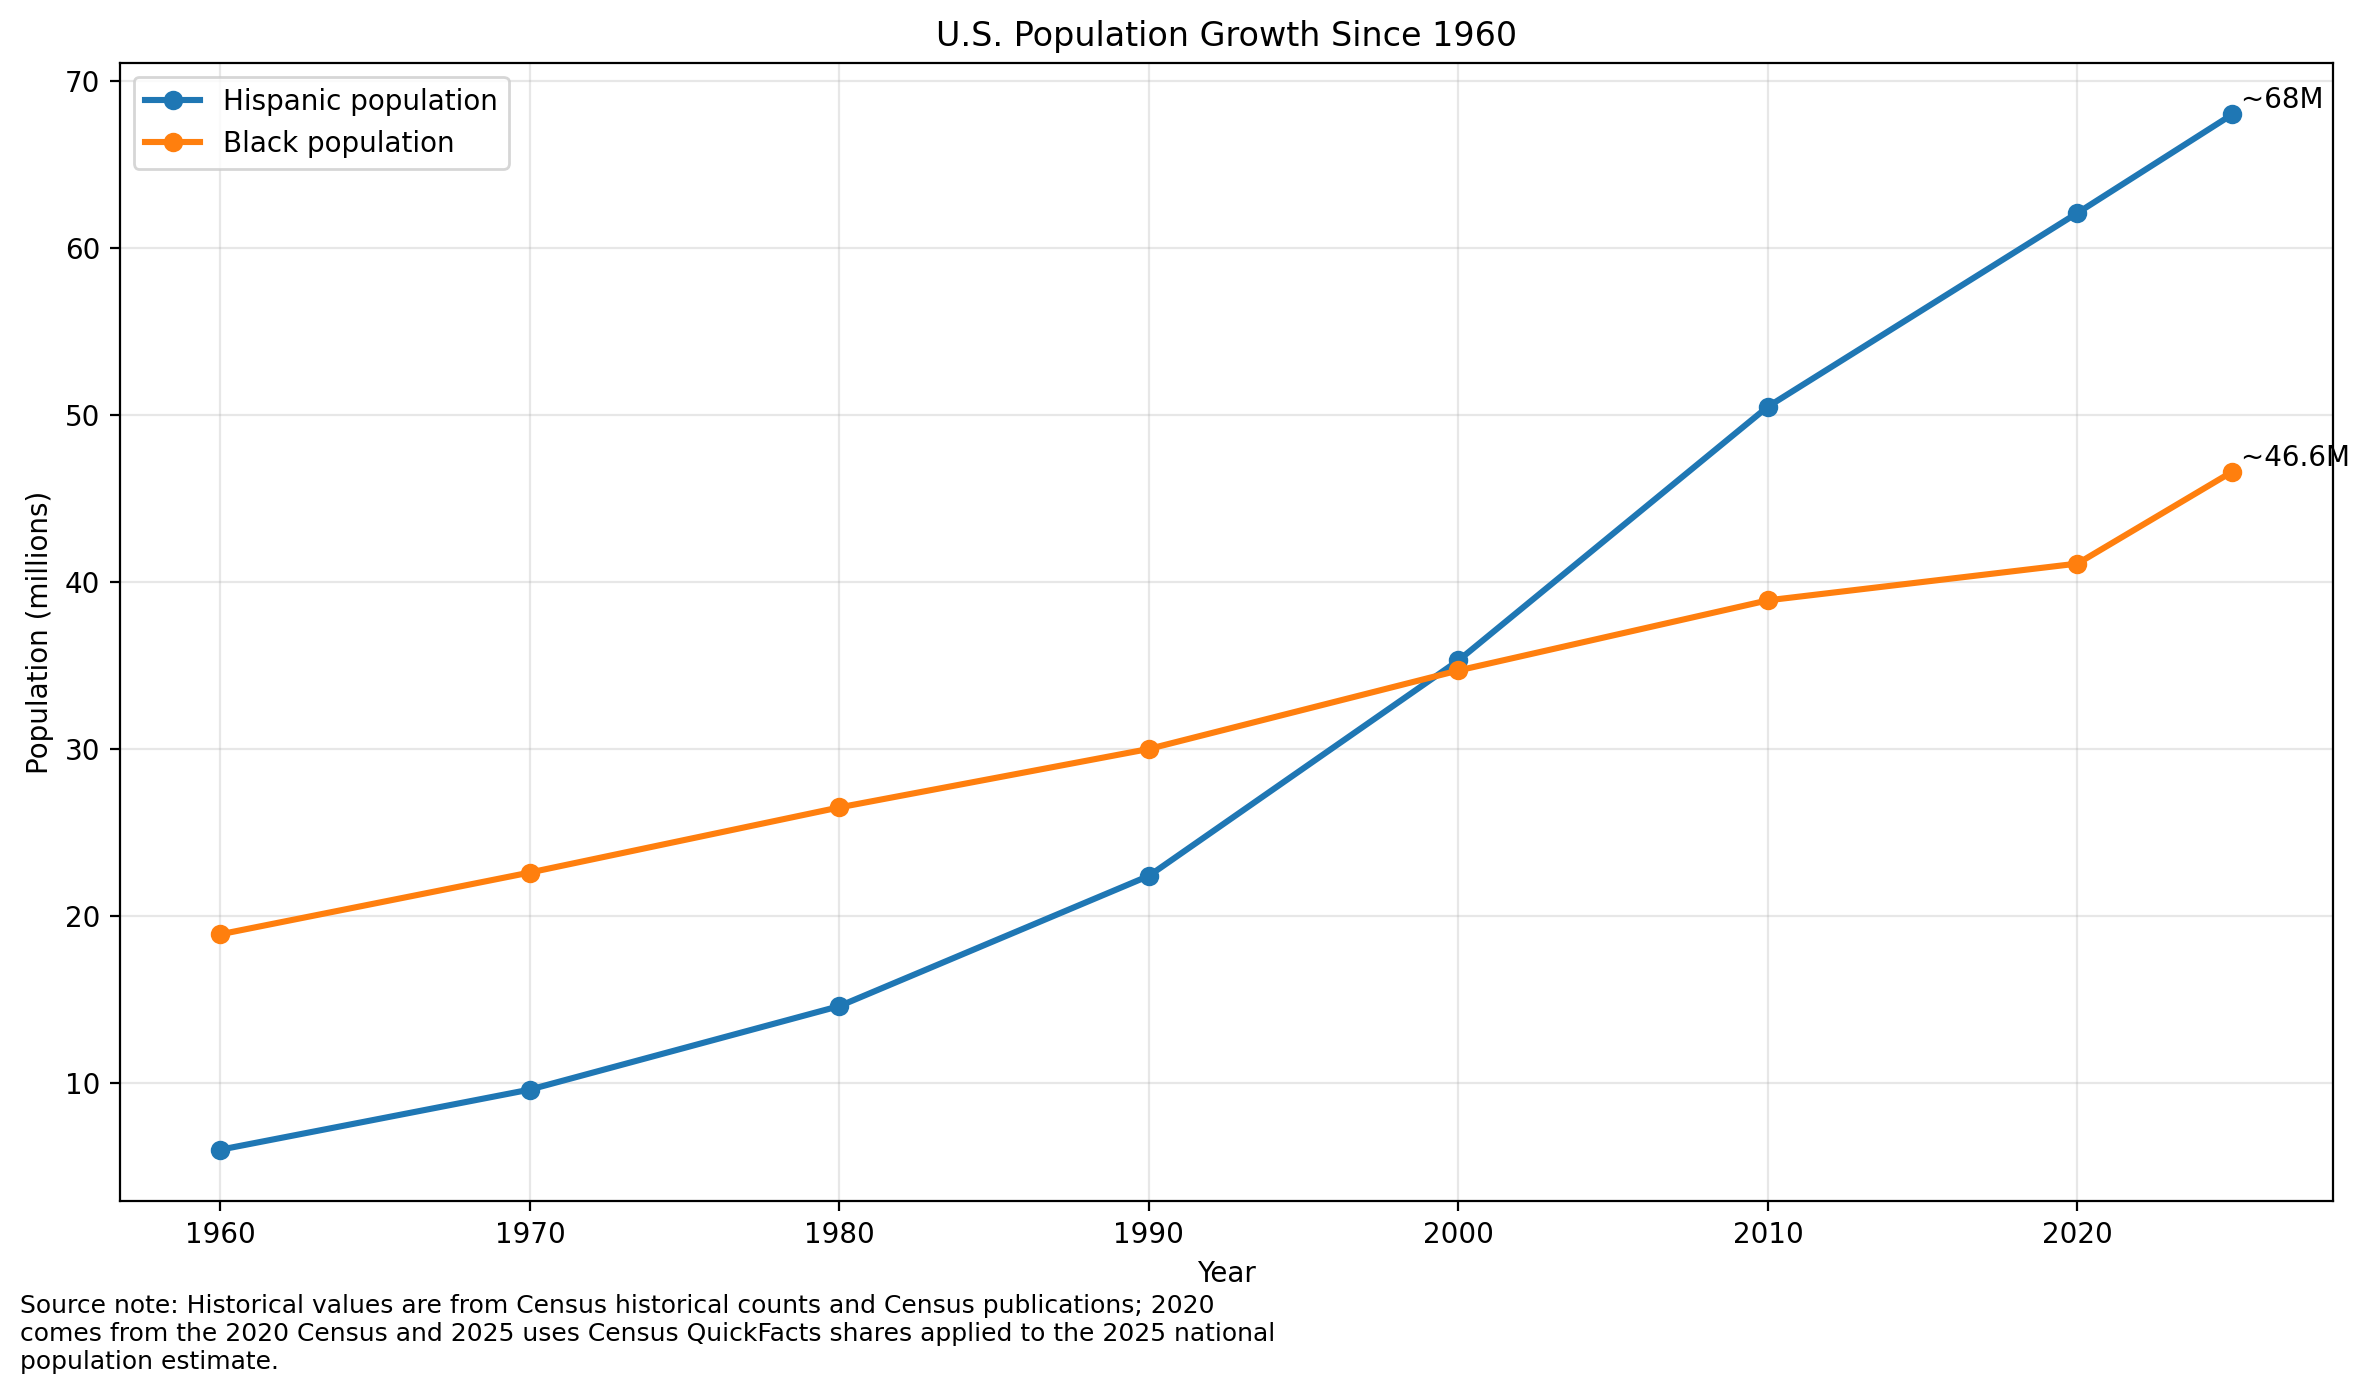
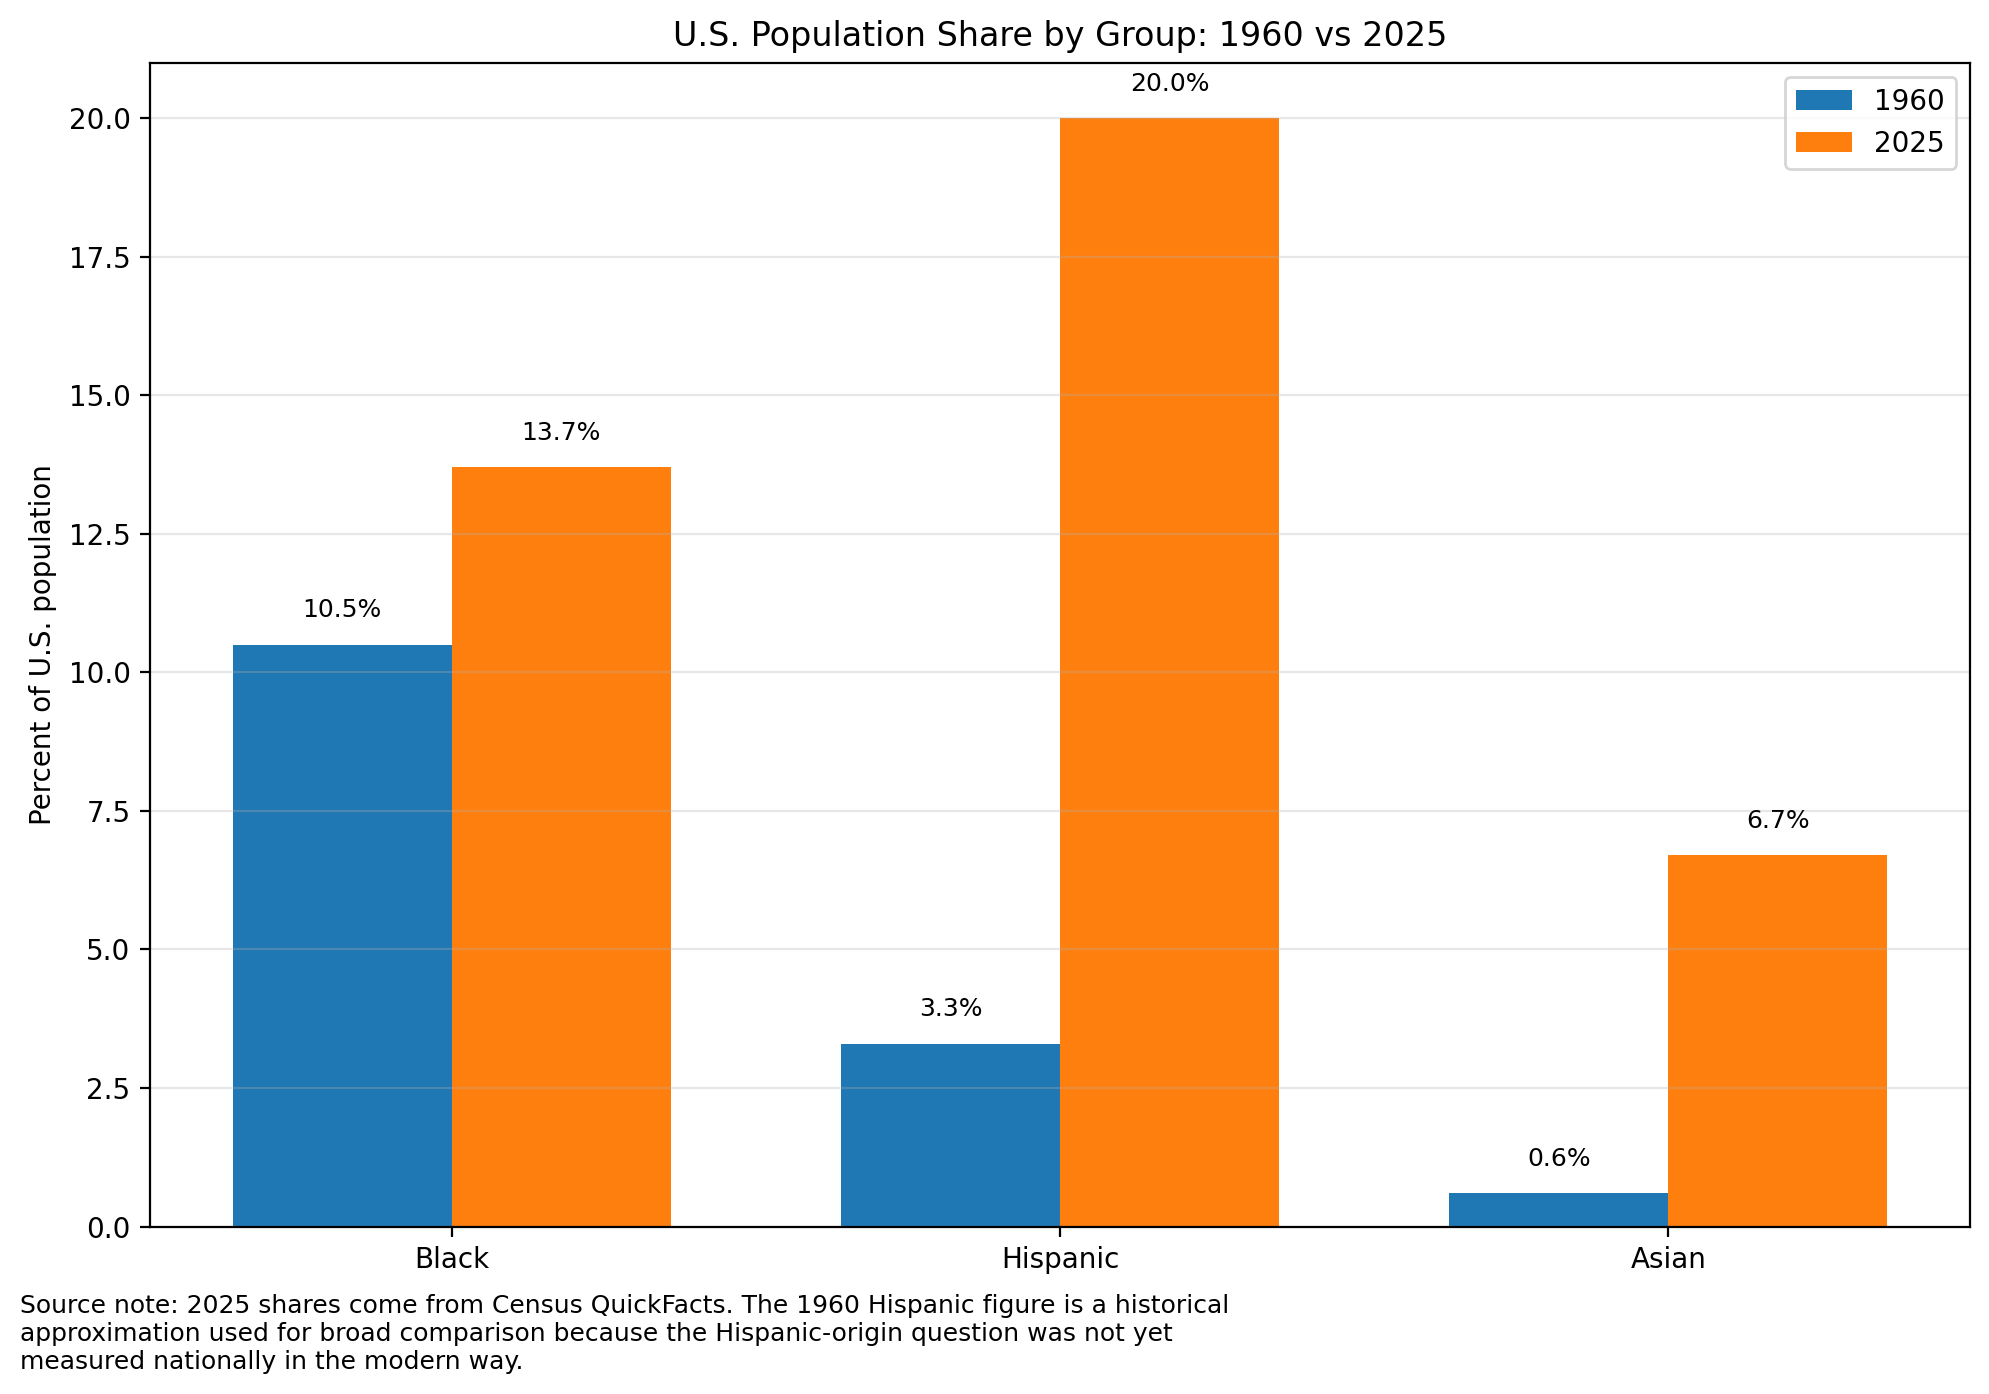
Recent Census estimates put the Hispanic share of the U.S. population at about 20 percent, or more than 65 million people. Black Americans account for roughly 13 to 14 percent of the population, or about 47 million. Asians account for around 6 to 7 percent. These are not marginal differences. They reflect a change in national population rankings that should have been predicted several generations ago.
For most of American history, the second largest population group in the country was Black Americans. That position developed over centuries, beginning with the Transatlantic Slave Trade and continuing through the aftermath of the American Civil War. It expanded during the Great Migration, when millions moved into northern and midwestern cities.
By 1960, Black Americans made up about one-tenth of the population. That share came from long-term internal growth rather than large-scale recent immigration.
What Changed After 1965
The shift that followed occurred within a much shorter span. After the Immigration and Nationality Act of 1965, immigration patterns changed in both scale and origin. The law replaced a quota system tied to national origin with one that emphasized family reunification and new admission categories. Over time, this produced sustained increases in immigration from Latin America and Asia.
At the time, supporters argued that the law would not significantly alter the country’s demographic balance. Senator Ted Kennedy (D) stated that it would not upset the existing ethnic composition. The decades that followed produced a different outcome.
In 1960, the Hispanic population was about 6 million. By 2026, it exceeds 65 million. That increase did not come from a single source. It reflects both continued immigration and a younger population structure that produced higher rates of natural growth in earlier decades.
The Pattern Across American Cities
The national figures point in that direction, but the change becomes clearer when you look at individual cities.
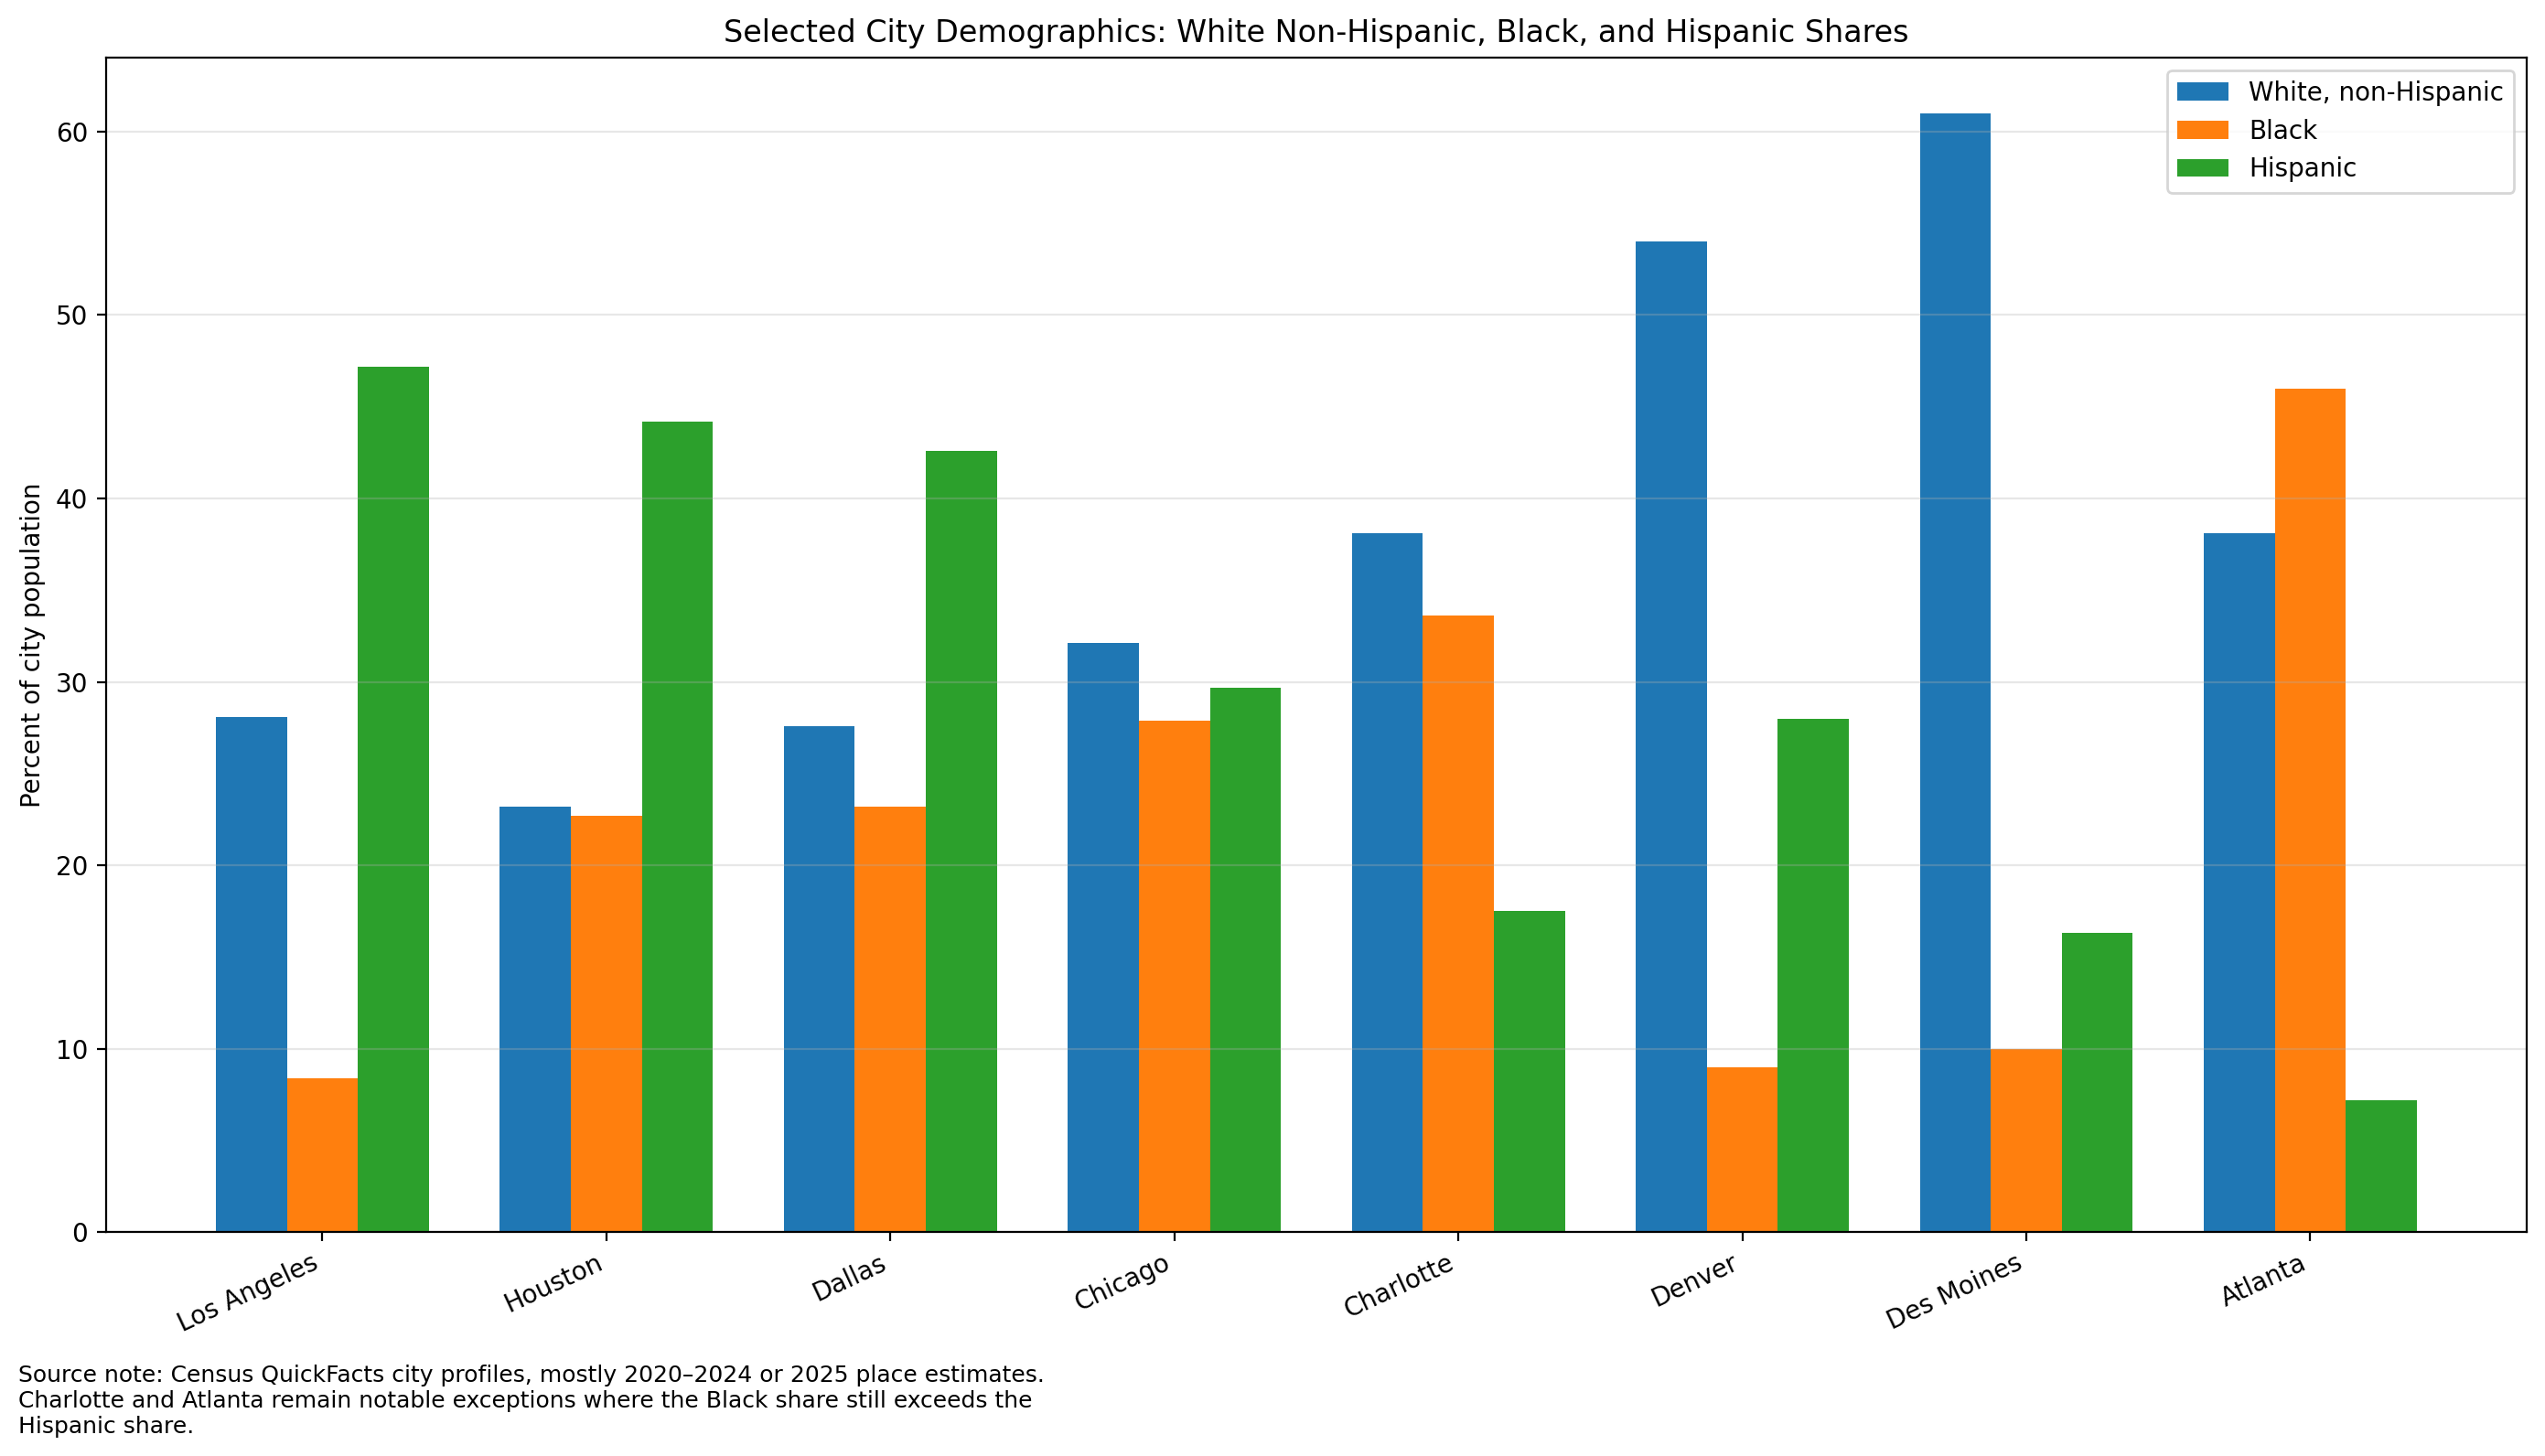
In Los Angeles, Hispanics make up roughly 47 percent of the population, compared with about 26 percent White non-Hispanic and less than 10 percent Black. In Houston, Hispanics account for about 44 percent, while White non-Hispanic residents are around 23 percent and Black residents about 22 percent. In Dallas, Hispanics are roughly 42 percent, with Black residents near 24 percent and White non-Hispanic under 30 percent.
These are not isolated cases tied to geography alone. They are major economic centers, and in each case Hispanics represent the largest population group.
What makes the pattern harder to dismiss is that it extends beyond traditional gateway cities.
In Charlotte, North Carolina, a city that for most of the twentieth century was largely defined by a Black-and-White population structure, Hispanic growth has accelerated in recent decades. A similar shift can be seen in Columbus, Ohio, where the Hispanic population has grown steadily despite the city having no historical identity as an immigration hub.
These “interior” cities do not have the same long-standing demographic history as places like Los Angeles or Houston. The emergence of a third large population group in these areas represents a structural change rather than a continuation of an older pattern.
The same direction appears even where the margins are narrower.
When people think of Chicago, they tend to picture a cold, industrial Northern city with a large and historically rooted Black population.
They do not usually think of it as a city where Hispanics have overtaken Blacks demographically. But that is exactly what the numbers now show.
In Chicago, Hispanics account for about 29 percent of the population, slightly ahead of Black residents at roughly 28 percent. In Denver, Hispanics make up close to 29 percent, while Black residents are under 10 percent. In Des Moines, Hispanics are about 15 percent, compared with roughly 10 percent Black and 4 percent Asian.
These cities differ in size, geography, and economy, yet the same basic pattern appears.
There are still places where the earlier structure remains more visible. In Atlanta and Philadelphia, Black residents remain the second largest group. But across regions, those cases are becoming less representative of the broader trend.
Speed Matters More Than Size
The scale of the change is significant, but the speed is what makes it unusual.
From 1960 to 2026, the Hispanic population grew from roughly 6 million to more than 65 million, an increase of over 1,000 percent. Over that same period, the Black population grew from roughly 19 million to about 47 million, an increase closer to 150 percent.
Both are increases. Only one reflects a rapid demographic surge.
The difference is not only in how fast the population grew but also in its structure. The median age of the Hispanic population is around 30, while the median age of the non-Hispanic White population is closer to the low 40s. That gap matters because it means the growth is already embedded in schools, entry-level jobs, and the future workforce.
When timelines are compared, the contrast becomes difficult to ignore.
Black Americans have been part of the United States for more than 400 years, and their population grew primarily through internal expansion, shaped by historical events and migration within the country. The Hispanic population, at a national level, expanded largely in the post-1965 period.
What took centuries to build reached comparable scale in a single lifetime.
Labor Does Not Ignore Demographics
Demographic changes of this size do not remain confined to population tables. They affect labor markets.
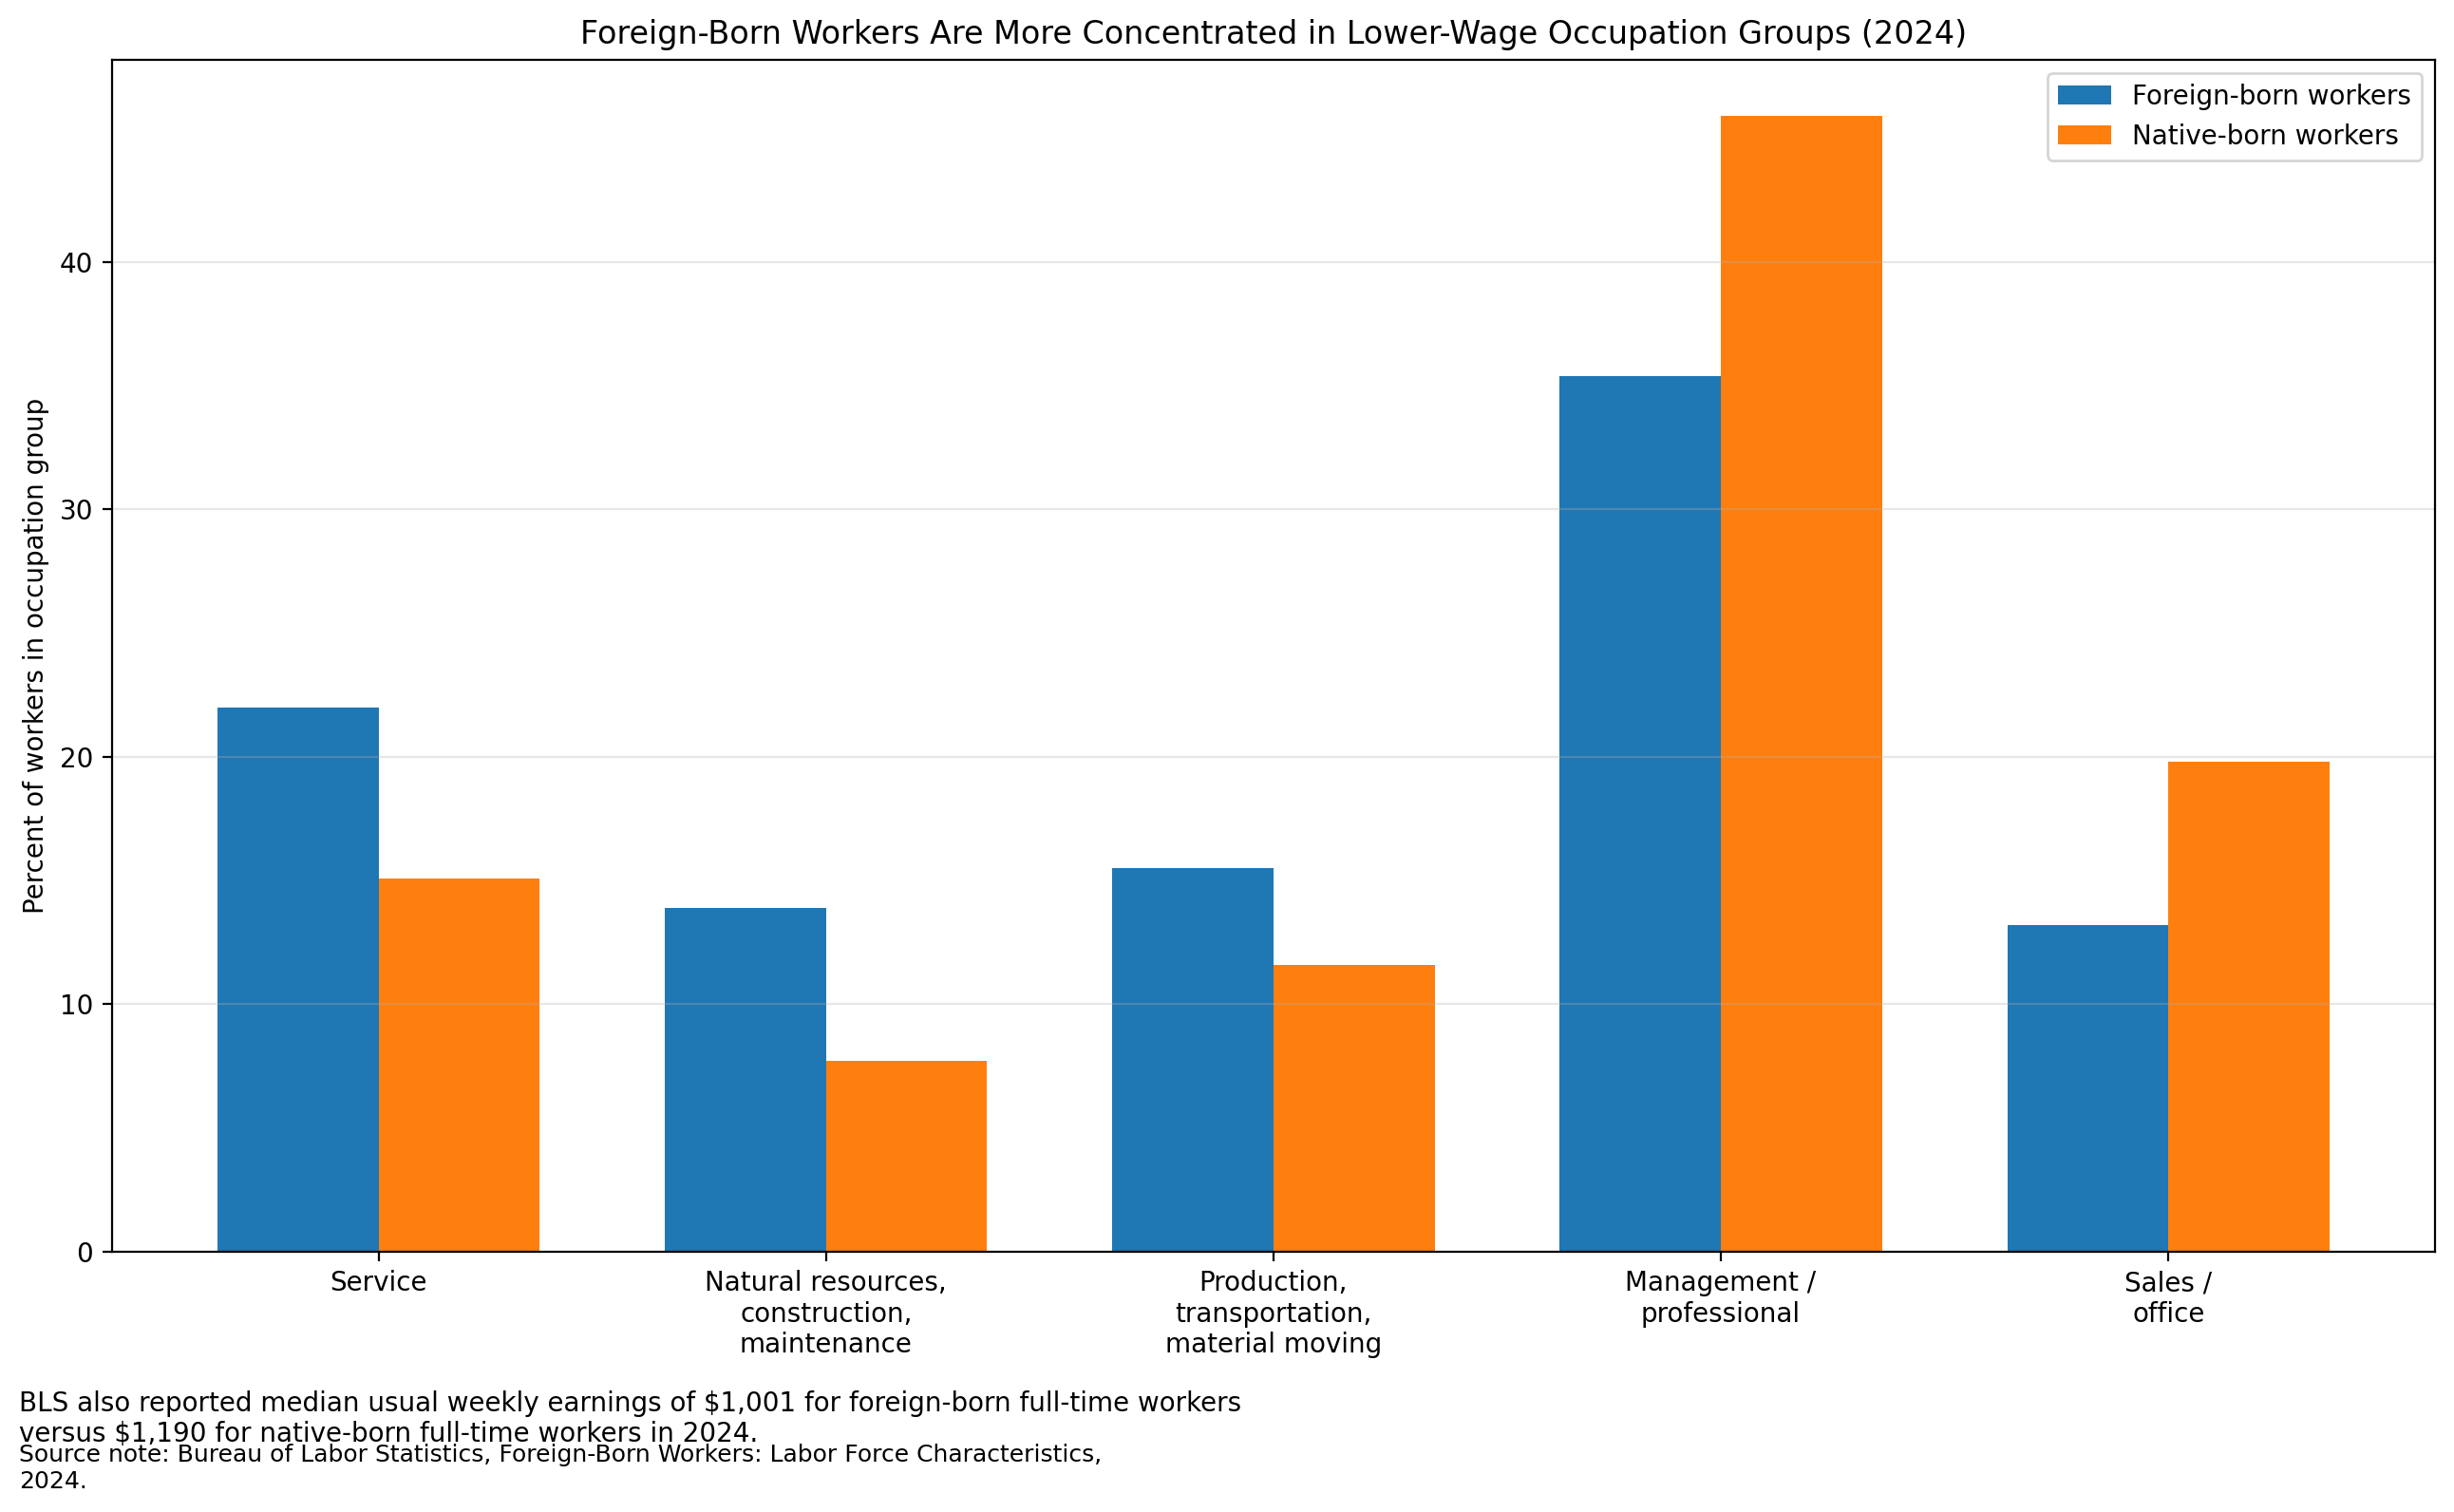
Before 1965, many lower-skilled jobs in urban areas were filled by workers without college degrees, including Black Americans and working-class whites. These jobs were not high-paying, but they provided a path toward economic stability.
When the supply of labor increases, competition changes. In industries such as construction, food service, and hospitality, the number of available workers expanded over several decades. Basic economic relationships still apply. When supply rises relative to demand, wages face pressure.
Research on immigration and labor markets often finds that overall effects are modest, but that negative impacts are more likely to be concentrated among workers with lower levels of education. That does not mean every worker is affected equally, but it does mean the effects are not evenly distributed.
The claim that immigrants take jobs “no one else wanted” does not fully capture how labor markets function. Jobs are shaped by wages, conditions, and the number of available workers. When the labor pool expands, the structure of the market shifts, and workers with fewer options tend to feel those changes first.
Politics Follows Population
The political consequences follow from the same logic.
Population is not simply a statistical measure. It translates into districts, outreach, messaging, and policy attention. Larger groups attract more sustained political focus over time.
At the local level, this shift becomes more visible. In many cities, districts that were once associated with Black political representation are becoming more demographically mixed or predominantly Hispanic. As that happens, representation becomes less straightforward. What was once a stable arrangement begins to shift, often within the same party.
Political coalitions adjust to these changes. The Democrat Party, like any political organization, responds to where it sees long-term growth. That response appears in messaging, priorities, and the allocation of attention.
Some will argue that moving from second place to third place in population share is not significant. In a democratic system, it is. Population size influences political leverage over time. Larger groups tend to attract more attention, more resources, and more sustained engagement.
What This Means Now
This does not mean that one group disappears or that another immediately replaces it in every respect. It means that the center of gravity shifts.
Black Americans developed a dense institutional and cultural presence over generations, including churches, civic organizations, and educational institutions. That infrastructure reflects centuries of history.
Newer demographic growth expands more quickly than institutions typically develop. As that process unfolds, demands for representation, resources, and influence tend to increase.
Political coalitions do not change because of speeches. They change because the numbers change.
That was the argument in The Replacement Blacks. What the data here shows is how that shift has already taken shape.
In a democratic system, population becomes leverage, and leverage becomes attention. Over time, attention becomes power.
The question is no longer whether the shift is happening. The question is what happens next.
Help Keep Work Like This Going
This piece wasn’t written off headlines or talking points. It took time to go through the data, connect the patterns, and lay it out in a way that’s clear and honest.
That kind of work doesn’t come from corporate media, political organizations, or donors. It comes from readers who think it matters.
Become a Paid Subscriber
If you want more writing that actually digs into the numbers and explains what’s happening—not what you’re told to believe—become a paid subscriber.
Your support isn’t symbolic. It’s what allows this to continue.
Make a One-Time Gift
If you’d rather support the work directly without a subscription, you can do that here:
Every contribution helps keep this independent.
Join The Resistance Core
For those who want to go further and actively support this work at the highest level:
This is the core group helping ensure this project continues to grow and reach more people.
What Your Support Builds Right Now
More data-driven investigations like this
Time to research, verify, and explain complex issues
Independent writing that isn’t filtered through media or political incentives
If You Cannot Give
You can still help in a meaningful way:
Share this post
Restack it
Send it to someone who needs to see it
That kind of support matters more than most people realize.